
The modelling process for management strategy evaluation (MSE) requires sophisticated technical expertise, but interpreting the results shouldn’t require the same skillset. Carefully designed and annotated data visualizations can give audiences the information they need to select which candidate harvest strategy would best meet their management objectives. Graphical plots, tables, and interactive tools should all be used to suit a diversity of learning styles. Consistency is key, both within and among management bodies, so fisheries managers and stakeholders can become familiar with each presentation style, easing interpretation of MSE results for other stocks. Finally, less can be more. If the entire package of results is available upon request, only the results most relevant to the decision-making process need to be presented.
Click on a thumbnail below to see the full graphic
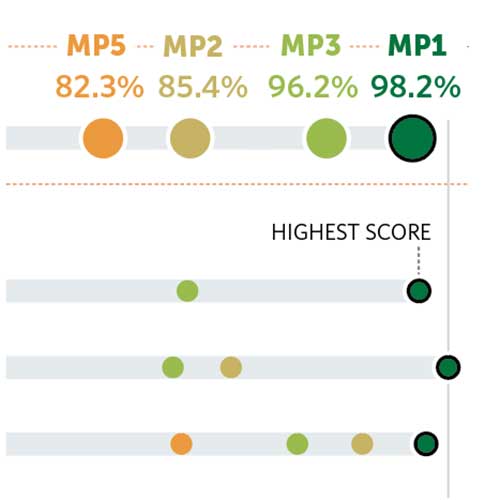
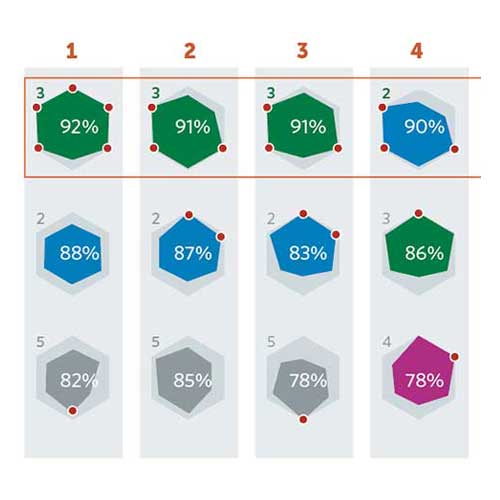
Performance Comparison
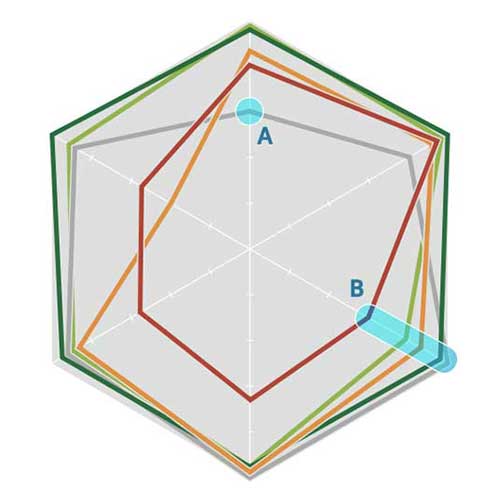
Performance Comparison
Performance Comparison
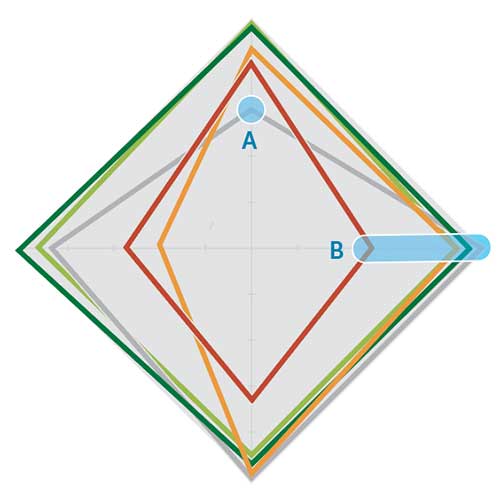
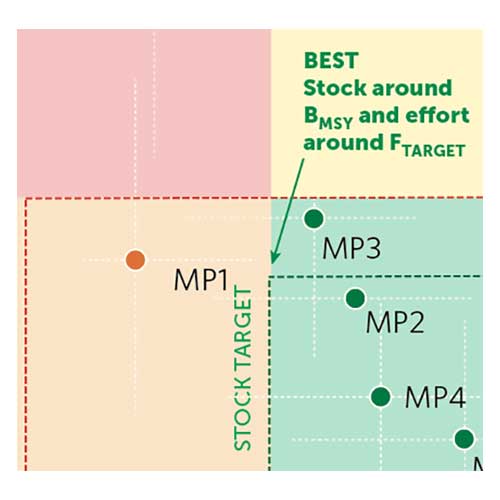
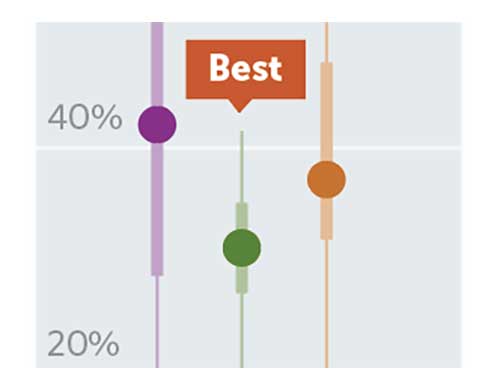
Trade-off: catch/biomass
Trade-off: catch/biomass
Trade-off time series: catch/biomass
Performance Comparison
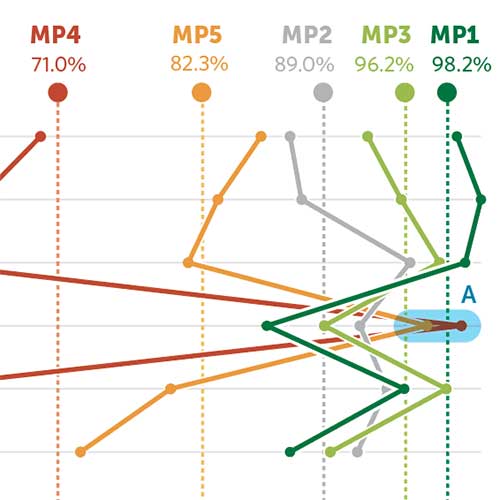
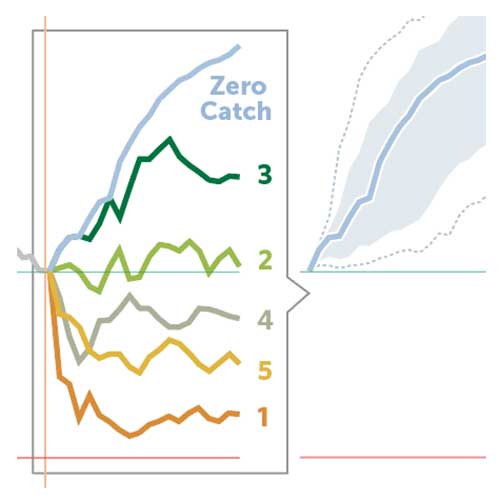
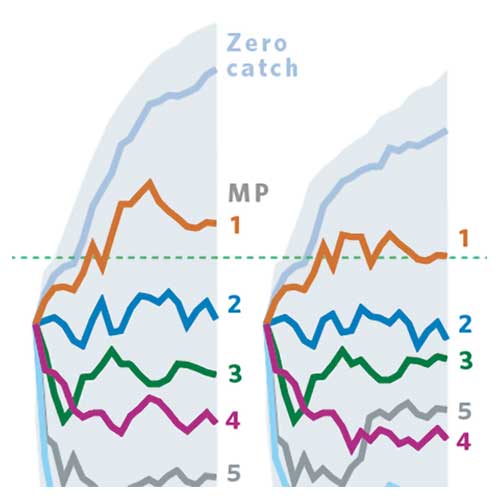
Stock size projection
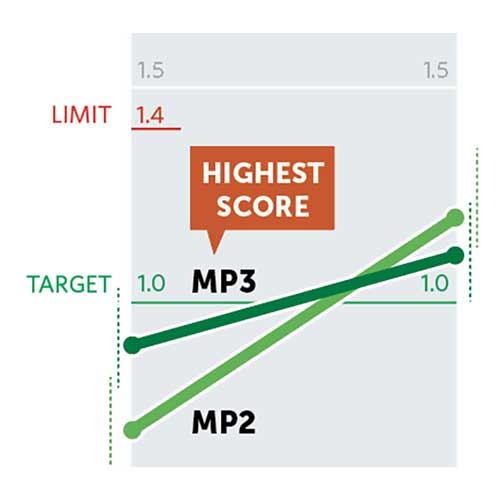
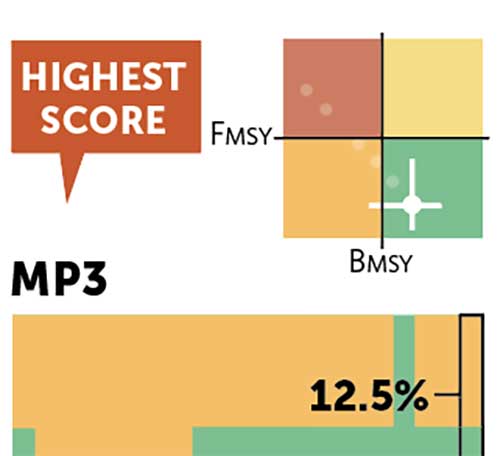
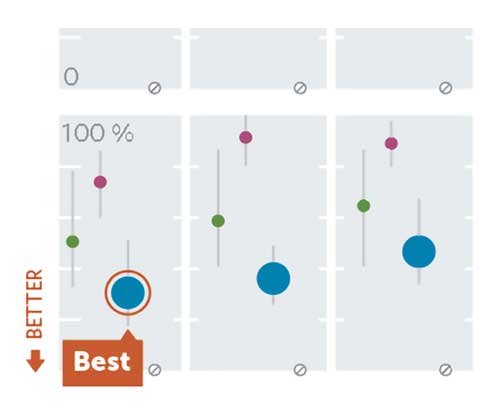
Trade-off and performance: catch/biomass
Performance Comparison
Stock size projection
Trade-off and performance: catch/biomass
This package of graphical tools was developed in partnership with an expert scientific communications firm to maximize the data presented while also stressing correct and thorough understanding of the results. Each plot depicts the performance of multiple candidate harvest strategies against pre-agreed management objectives. These plots show results across different dimensions to highlight various elements:
All plots are open source and can be used for individual MSE processes. The R code for each plot can be found in the shiny app, and a host of slide templates are available for showcasing any final results. The Indian Ocean Tuna Commission has also developed a package of plots and a summary table for use in presenting MSE results.
July 1, 2026