
Stocks with active harvest strategies
Stocks with harvest strategies in development
CCSBT
Adopted in 2011; updated in 2019
See full information
NAFO
Adopted in 2010; Updated in 2017 and 2024
See full information
IOTC
Adopted in 2016, Updated in 2024
See full information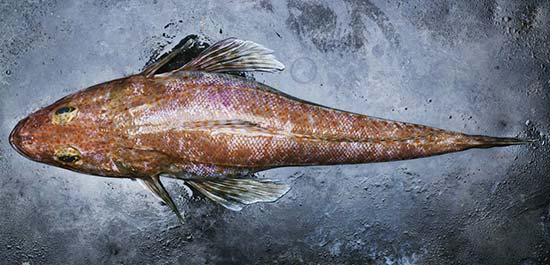
Australia (domestic)
2009, Amended 2021
See full information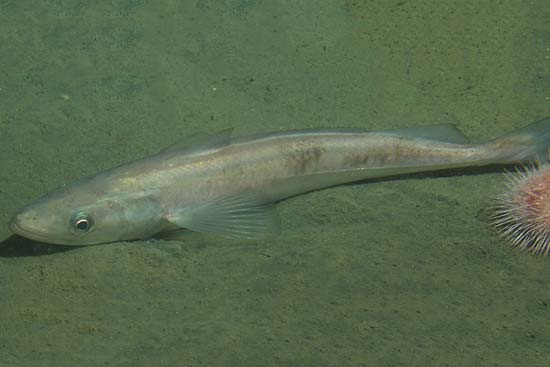
South Africa (domestic)
1990; Updated in 2022
See full information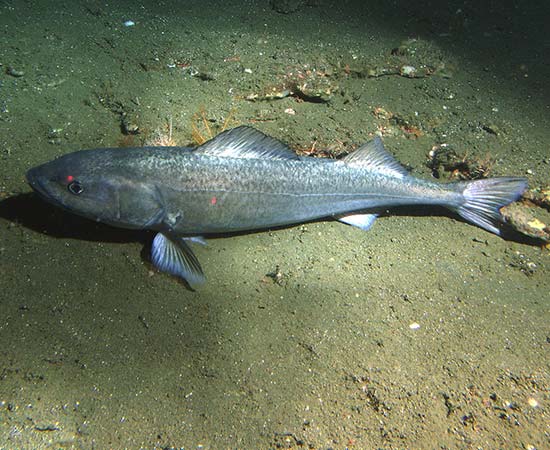

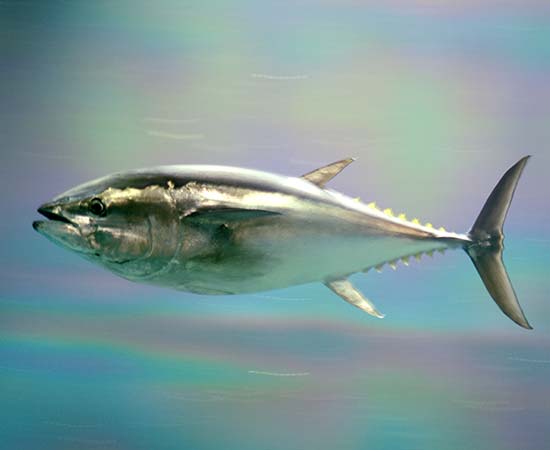
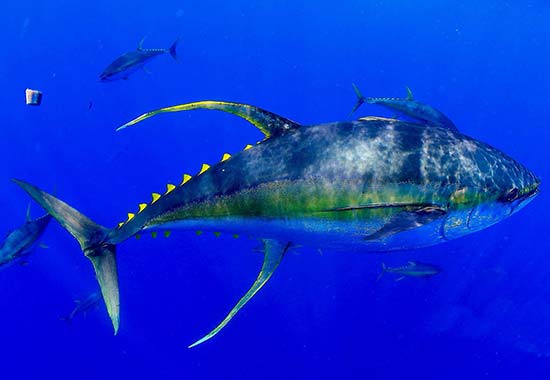
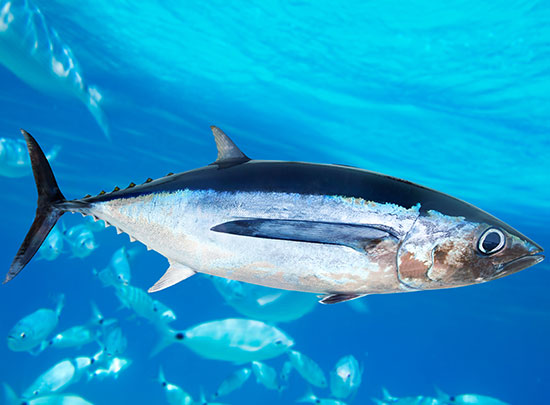


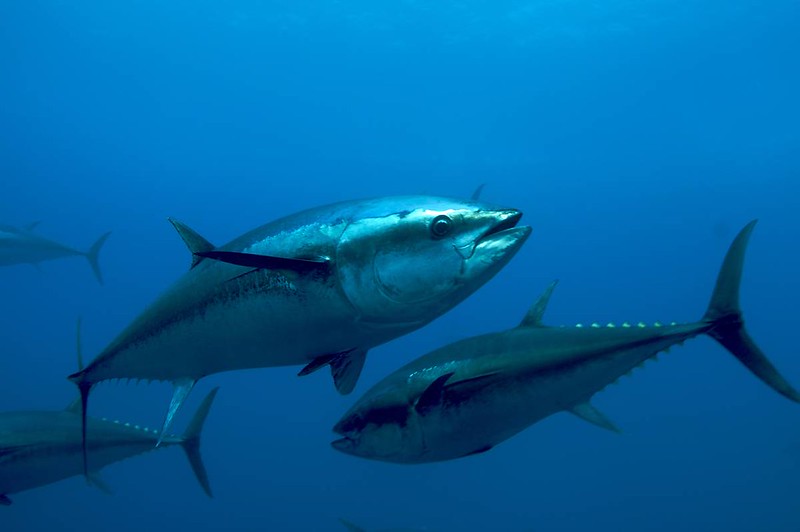

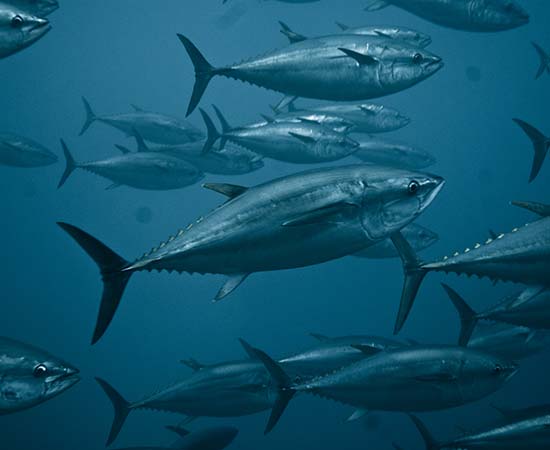
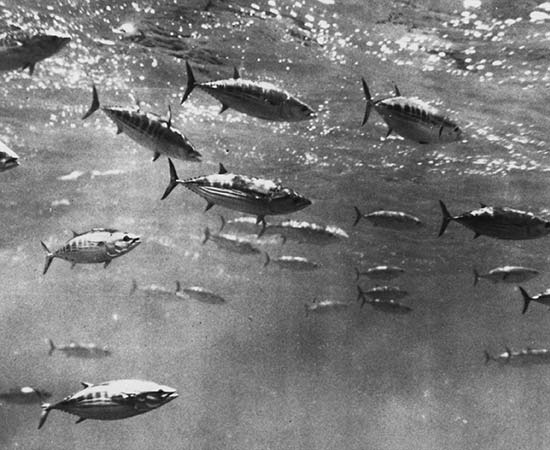
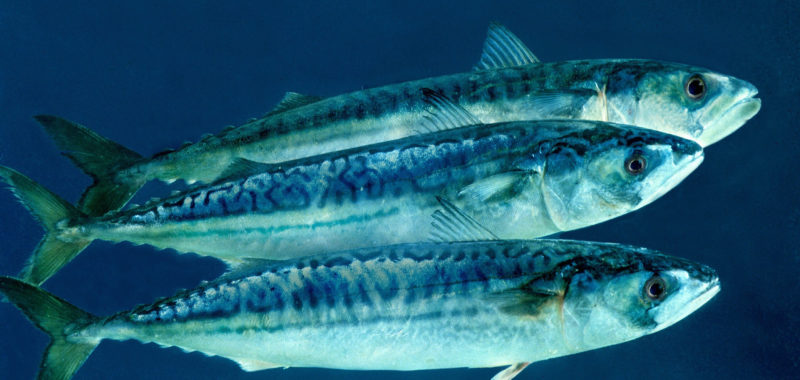


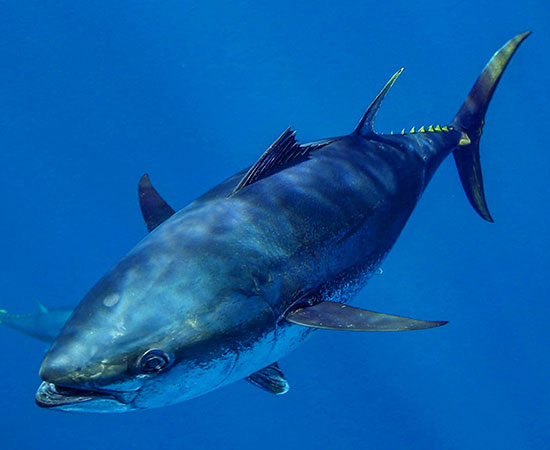
Tuna
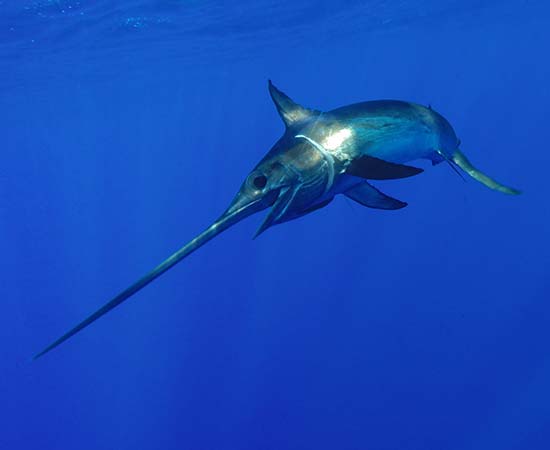
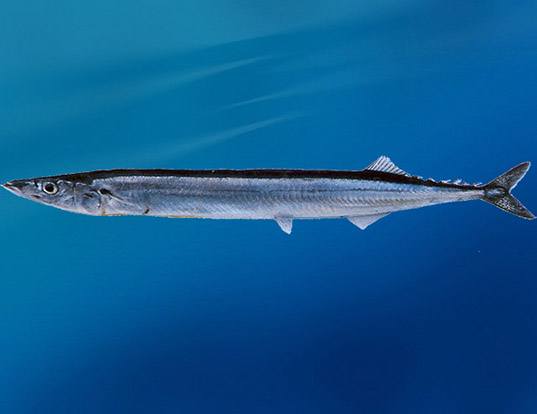
Swordfish
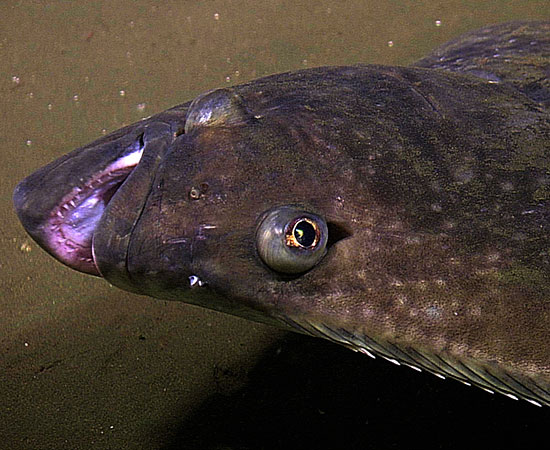
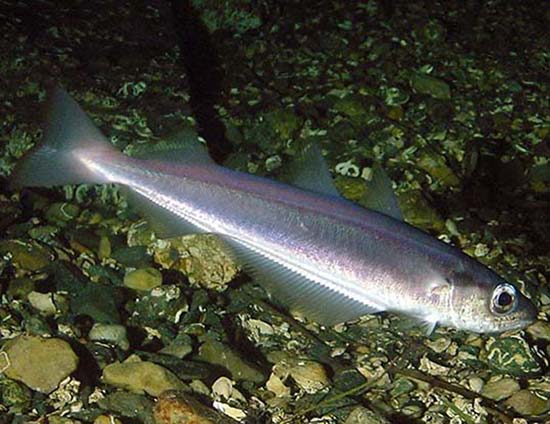
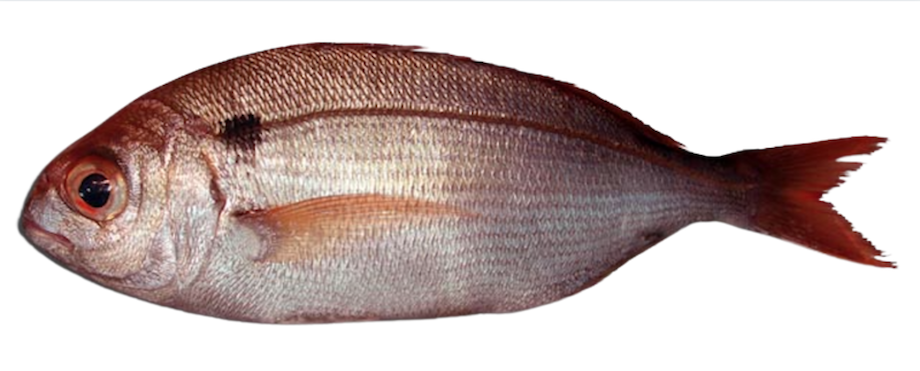
Bottomfish
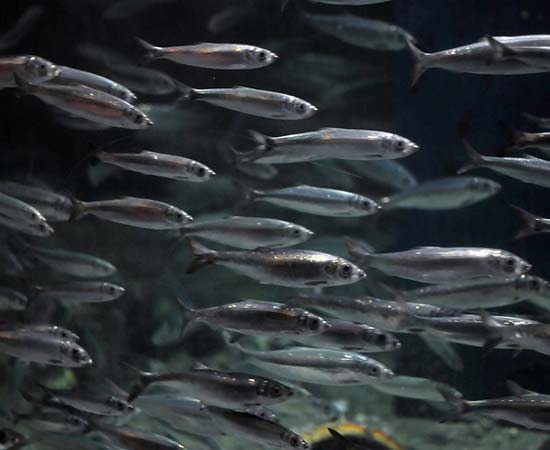
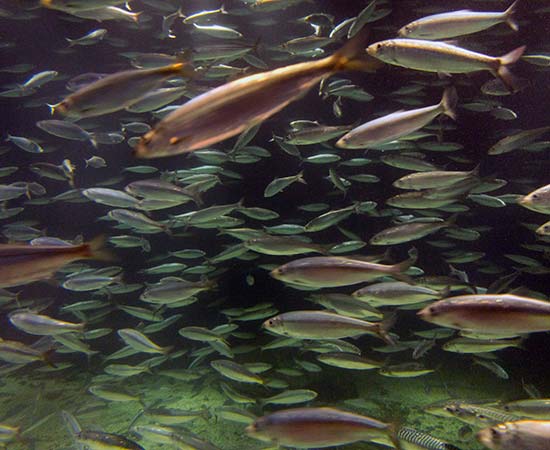
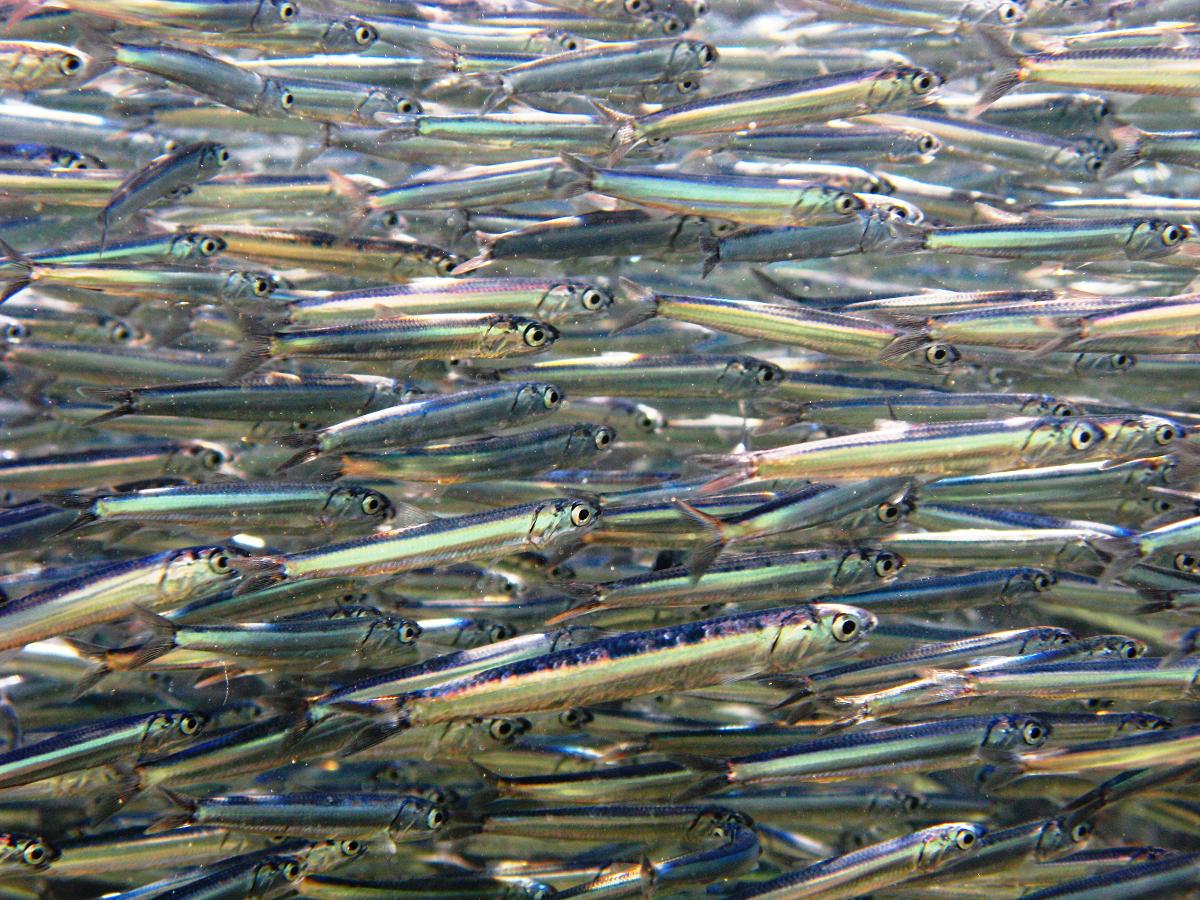
Forage Fish
Shark
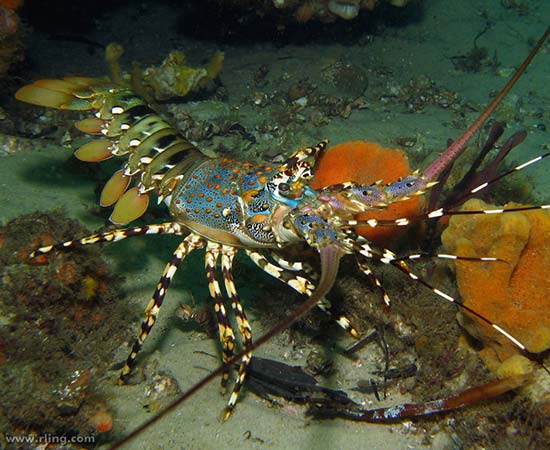
Lobster
Harvest strategies are a tool that is being used successfully around the world for all different types of fisheries – predators and prey, surface species and bottomfish, international and domestic. This interactive map showcases the global breadth of harvest strategies, including both active harvest strategies (in teal) and those in development (in orange). Navigating this interactive is easy- click on any silhouette to view the details of a that fish’s harvest strategy in that particular location.
Is your stock missing from the map? We want to include you!
FACTSHEET: Case Studies of Harvest Strategies in Global Fisheries; Language Options: Español 🇪🇸 • Français 🇫🇷 • 日本 🇯🇵 • ไทย 🇹🇭
1Active Harvest Strategy

Commission for the Conservation of Southern Bluefin Tuna
Adopted in 2011; updated in 2019
*SSB0 = spawning stock size that would exist in the absence of fishing
Fully-specified ‘Cape Town Procedure’ adopted in 2019 was tested through comprehensive MSE process.
Specifications:
Quotas have increased each management cycle since the harvest strategy was adopted (an 87% increase between 2011 and 2020). The number of adult fish increased from 5% SSB0 in 2010 to 20% SSB0 in 2020.
2Active Harvest Strategy
International Commission for the Conservation of Atlantic Tunas
2017/2021
Adopted in 2021, ICCAT successfully converted the HCR into a full harvest strategy through the addition of an exceptional circumstances protocol and the specification of the data collection and assessment methods needed to apply the HCR.
Specifications:
The stock was declared recovered in 2016, a year before the HCR was adopted. The 2018-20 quota set by the HCR was limited by the 20% maximum change clause included in the original HCR. Using the 2020 stock assessment, the HCR recommended a TAC increase for the 2021-23 management period which was agreed to by all parties without controversy, despite the virtual meeting necessitated by COVID-19.
3Active Harvest Strategy
Northwest Atlantic Fisheries Commission
Adopted in 2010; Updated in 2017 and 2024
The original HCR adopted in 2010 proved unsuccessful and was modified in 2017 and updated again in 2024. The current harvest strategy will be implemented from 2025 until 2034. If circumstances occur outside the ranges tested by the MSE, the exceptional circumstances protocol will be triggered, possibly changing the HCR.
Specifications:
Greenland halibut are considered overfished. The initial HCR adopted in 2010 had to be revised in 2017 as the exceptional circumstance protocol was triggered in 4 out of 6 years, likely due to annual catch estimates far exceeding the TAC. An updated HCR was adopted in 2024. Exceptional Circumstances were occurring in the first year due to recent gaps in the EU Spain 3L series. However, sensitivity analyses indicated that the application of the HCR adopted in 2024 will still be appropriate. The TAC for 2025 derived from the MP is 14,791 t.
4Active Harvest Strategy
Indian Ocean Tuna Commission
Adopted in 2016, Updated in 2024
• At least 50% probability that the skipjack tuna spawning stock biomass achieves the biomass level of 40% SB0 by 2034-2038.
• The skipjack tuna spawning stock biomass is maintained above the biomass of SBMSY with very high probability.1 .
• The skipjack tuna spawning stock biomass is maintained above the biomass of 20% of SB0 at all times.
• Interim Limit Reference Points: 20% of unfished spawning biomass (i.e. 0.2SB0)
• Interim Target Reference Points: 40% of unfished spawning biomass (i.e. 0.4SB0).
*SB0 = spawning stock size that would exist in the absence of fishing
IOTC adopted a fully specified harvest strategy in 2024.
The maximum change in the TAC shall be a 15% increase and a 10% decrease relative to the previous TAC.
Progress Update & Workplan: The MP was adopted in 2024, and an implementation plan will be developed no later than 2026.
Navigate to Resolution 24/08 to view the management procedure for skipjack in the IOTC area of competence https://iotc.org/cmm/resolution-2407-management-procedure-skipjack-tuna-iotc-area-competence
Resolution 15/10 on Target and Limit Reference Points and a Decision Framework (https://iotc.org/cmm/resolution-1510-target-and-limit-reference-points-and-decision-framework)
5Active Harvest Strategy
Australia (domestic)
2009, Amended 2021
Biological
Socio-economic
Ecosystem
This fully specified, MSE-tested harvest strategy framework applies to the Southern and Eastern scalefish and shark fishery, with each stock applying one of four different HCRs included in the harvest strategy. Tiger Flathead is considered a Tier 1 species, but with a default Recommended Biological Catch (RBC) calculated using a 20:35:40 reference point strategy.
Data inputs: Catch, CPUE, discards, survey relative abundance, size, and age data
Harvest control rule: If B is below the limit reference point, no targeted fishing is allowed and a rebuilding strategy will be developed; if B is below the trigger reference point, the TAC declines linearly toward the target to allow the stock to rebuild to the target level; if B is above the target reference point, fishing is set at a level of F that produces the target biomass, (i.e., F40).
According to the most recent 2022 stock assessment, the stock is not overfished nor undergoing overfishing and was projected to be at 43% of unfished spawning stock biomass in 2023, which is above the target reference point (40% B0). The 2022 assessment concluded that steepness (h) should be fixed in future assessment iterations; under these assumptions, the TRP would return to a default Tier 1 harvest strategy form, with a TRP of 48%B0.
6Active Harvest Strategy
South Africa (domestic)
1990; Updated in 2022
Maintain both stocks about BMSY and balance trade-offs between catch, effort and inter-annual variability in TAC
Target Reference Point: BMSY
A fully specified harvest strategy that has been tested via MSE. It includes rules for Exceptional Circumstances for when certain key indices drop below pre-determined threshold values, or when further observations fall outside the range tested within the MSE. Operating models for the MSE continue to be updated, most recently in 2023, to account for new data.
Specifications:
The 2023 update to the reference case operating models showed both hake stocks
above the B-based target reference points. The TAC trend has been increasing since
2022; although commercial catch rates for hake are down, particularly for M. capensis,
survey abundance indices have been exceptionally high. The low catch rates are not
sufficient to trigger Exceptional Circumstances. The Operation Management Procedure
will be reviewed in 2026, as per the routine 4-year revision cycle.
Update to the hake Reference Case Operating Model with the 2022 commercial and 2023 survey data
7Active Harvest Strategy
Canada (domestic)
2010
A fully specified harvest strategy that has been tested via MSE. Operating models for the MSE continue to be updated, most recently in 2019, to account for new data.
Specifications:
The most recent update to the sablefish operating models (OMs) occurred in 2022; at this time, it was determined that the stock was above the target biomass of BMSY (i.e., not overfished) and below the associated harvest rate, UMSY (i.e., not undergoing overfishing). Following the rules of the adopted MP, the TAC for the 2024-2045 fishing year remained the same as the previous year (3,029 tonnes) and will be re-evaluated in 2025. The next OM revision will occur between 2026 and 2028.
Integrated fisheries management plan summary: Groundfish – Pacific Region, 2025
8Active Harvest Strategy
New Zealand (domestic)
1997
Per New Zealand’s Harvest Strategy Standard:
CPA 7:
Target reference point: CPUE = 1.75 kg/potlift
Soft limit point: CPUE = 1.0 kg/potlift
Hard limit point (TACC = 0): CPUE = 0.17 kg/potlift
If the CPUE is 0.17 kg/potlift or below, the TACC is zero; the TACC increases linearly with CPUE when CPUE is between 0.17 – 1.0 kg/potlift to a plateau of 80 tonnes, which extends to a CPUE of 1.75 kg/potlift; TACC increases linearly as CPUE increases above 1.75 kg/potlift.
CPA 8:
Target reference point: CPUE = 7.0 kg/potlift
Soft limit point: CPUE = 3.4 kg/potlift
Hard limit point (TACC = 0): CPUE = 0.5 kg/potlift
If the CPUEs between zero and 0.5 kg/potlift the TACC is zero; the TACC increases linearly with CPUE to 1251 tonnes at a CPUE of 3.4 kg/potlift; the TACC remains at 1251 tonnes until CPUE reaches 7.0 kg/potlift, and then increases by 5.5% for each CPUE step of 1.0 kg/potlift
Type: Empirical
Management Cycle: annual
Data inputs: CPUE
Management outputs: Total Allowable Commercial Catch (TACC)
Harvest control rule: CRA 7: generalized plateau slope rule; CRA 8: generalized plateau step rule
Other: CRA 7 has a 10% minimum change in TACC and a 50% maximum change in TACC; CRA 8 has a 5% minimum change in TACC and no maximum change limit
The commercial fishery for rock lobster in New Zealand is managed for nine Quota Management Areas (QMAs). Five of the QMAs historically had longstanding MPs in place (CRA 3, CRA 4, CRA 5, CRA 7, and CRA 8), but many of these MPs have been suspended due to data availability issues or have had their results rejected by managers within recent years. The CRA 7 QMA MP was reinstated for operation in 2023 for use in setting TACC in future years, and the MP for QMAs CRA 7 and CRA 8 were evaluated in 2024. The 2024 evaluation resulted in an increased total allowable commercial catch (TACC) in area CRA 7 and no change to the TACC in area CRA 8 for the 2025-2026 fishing year. The rock lobster stocks in CRA 7 and CRA 8, previously depleted, are now considered to be rebuilt due to management via MPs. The MP for CRA 7 will be evaluated again in 2026. A re-imagined MP for CRA 3 is potentially in development pending the results of the 2024 stock assessment.
9Active Harvest Strategy
United States Domestic Fisheries
2019
Upper biomass parameter (overfished threshold): 50%SSBMSY
Lower biomass parameter (closes fishery): 10%SSBMSY
Maximum fishing mortality: 80%FMSY
The measure includes only a harvest control rule as opposed to a full harvest strategy.
Specifications:
The MSE-tested HCR was implemented for the first time in 2019 and is still being used to determine the Acceptable Biological Catch (ABC) and resulting Acceptable Catch Limit (ACL) for the fishery. The 2024 stock assessment determined SSB2023/SSBMSY to be around 26%, below the upper biomass parameter; the recommended fishing mortality based on the ABC control rule, therefore, remains low for 2025-2027 to promote rebuilding.
10Active Harvest Strategy
Western and Central Pacific Fisheries Commission/ Inter-American Tropical Tuna Commission
2023
Considering the overarching objective of ensuring the sustainability of North Pacific albacore tuna and current fisheries supported by the stock in the Western and Central Pacific Ocean, the following management objectives are established:
A “hockey-stick,” model-based harvest control was adopted that decreases F from Ftarget once the spawning stock biomass drops below SSBthreshold toward the limit reference point, at which point the fishery is maintained at Fmin, a minimum allowed fishing intensity.
Although the management procedure was adopted, the RFMOs still need to adopt measures to relate fishing intensity to catch and/or effort for use in managing fishing activity
11Harvest Strategy in development
Western and Central Pacific Fisheries Commission/ Inter-American Tropical Tuna Commission
2025
WCPFC Interim Management Objective:
Second Rebuilding Target: 20%SSBF=0 by 2034 (Achieved)
Candidate Harvest Strategies: Model-based, sliding harvest control rules (two shapes) are being explored in the MSE work to develop a comprehensive harvest strategy. The HCRs are being tested with a limit that constrains changes in TAC between consecutive management periods of no more than 25%. The HCRs are also being tested with allocations tuned to reach the WCPO: EPO fishery impact ratio of 70:30 and 80:20.
Review of MSE results and adoption of management procedure scheduled for 2025.
Annex G and H of the Chair’s Summary of the 8th Joint IATTC and WCPFC Northern Committee Working Group Meeting on the Management of Pacific Bluefin Tuna. Chairs’ Summary of the 8th Joint IATTC and WCPFC-NC Working Group Meeting on the Management of Pacific Bluefin Tuna | WCPFC Meetings
12Harvest Strategy in development
Indian Ocean Tuna Commission
2026
Tuning Objectives (for MSE purposes):
Comprehensive harvest strategy proposed by Australia. MSE evaluating model-based HCRs with these candidate constraints:
13Harvest Strategy in development
Indian Ocean Tuna Commission
2026
Tuning Objectives (for MSE purposes):
Interim Limit Reference Point: 40% BMSY and 140% FMSY
Interim Target Reference Point: BMSY and FMSY
Model-based. Development of ABC approach (Approximate Bayesian Computation) underway. Testing of candidate harvest strategies to being in 2024-2025.
Tested with the following constraints:
Evaluation of candidate harvest strategies underway via MSE.
14Active Harvest Strategy
Indian Ocean Tuna Commission
2024
Management Objectives:
Adopted in 2024, IOTC adopted a fully specified harvest strategy.
Specifications:
If the recent CPUE is above the target CPUE and the CPUE trend is increasing, then the TAC is increased.
If the current CPUE is below the target CPUE and the CPUE trend is decreasing, then the TAC is decreased.
If the current CPUE relative to the target and the CPUE slope are in opposite directions, the TAC change could be in either direction, depending on the magnitude of these indicators, and the associated control parameters.
Formally, the future TAC is calculated as a proportion, 𝑇𝐴𝐶𝑚𝑢𝑙𝑡, of the current TAC, which is defined as:
𝑇𝐴𝐶𝑚𝑢𝑙𝑡 = 1 + 𝑘𝑎𝑆𝑙 + 𝑘𝑏𝐷
Where 𝑆𝑙 is the slope of the log CPUE over the last 5 years, 𝐷 is the difference between recent CPUE value (average over the last 3 years) and the target CPUE value (i.e. recent CPUE – target CPUE), and 𝑘𝑎 and 𝑘𝑏 are responsiveness parameters, where
𝑘𝑎 = 2.1
𝑘𝑏 = 1.2
Target CPUE = 0.7125
Other: the maximum change in the TAC shall be a 15% increase and 10% decrease relative to the previous TAC.
Progress Update & Workplan: The MP was adopted in 2024, and an implementation plan will be developed in 2025.
Navigate to Resolution 24/08 to view the management procedure for swordfish in the IOTC area of competence https://iotc.org/cmm/resolution-2408-management-procedure-swordfish-iotc-area-competence
15Active Harvest Strategy
Indian Ocean Tuna Commission
2022
General: Maintain the stock biomass in the green zone of the Kobe plot (not overfished and not subject to overfishing) while maximizing the average catch from the fishery and reducing the variation in the total allowable catch (TAC) between management periods.
Adopted in 2022, IOTC adopted a fully specified harvest strategy. An exceptional circumstances protocol still needs to be specified.
Specifications:
The harvest strategy-derived TAC will first be implemented in 2024. A mechanism to control catch will be developed in 2025 if an allocation scheme has not yet been agreed.
16Active Harvest Strategy
International Commission for the Conservation of Atlantic Tunas
2024
Exceptional circumstances protocol adopted in 2025.
Management procedure for North Atlantic Swordfish – Recommendation 25-10
17Active Harvest Strategy
International Commission for the Conservation of Atlantic Tunas
2022
*An exception will be made during the first application of the harvest strategy, during which changes in TAC shall not exceed a +20% increase or -10% decrease.
In 2022, ICCAT successfully adopted a harvest strategy for Atlantic bluefin tuna. The harvest strategy is comprehensive for the West and East & Mediterranean Sea stocks.
Specifications:
When the harvest strategy was run in 2025 to set the quota for 2026-2028, ICCAT members agreed to increase the quota for the Western area by 20% above what was allowed under the harvest strategy, as well as transfer 100 tons from the Eastern area to the Western area.
Therefore, the harvest strategy is still in place but not being fully implemented.
Atlantic Bluefin Tuna Harvest Strategy – Official Recommendation: The full recommendation adopted at the ICCAT 2022 commission meeting.
18Active Harvest Strategy
Western and Central Pacific Fisheries Commission
2022
Objective:
a) the spawning potential depletion ratio of skipjack tuna is maintained on average at a level consistent with the target reference point;
b) the spawning potential depletion ratio of skipjack tuna is maintained above the limit reference point with a risk of the limit reference point being breached no greater than 20 percent;
Performance Indicators:
a) Target reference point: Calculated on the basis of two spawning potential depletion values:
Both values are expressed as a percentage of the estimated average spawning potential in the absence of fishing (SBF=0), calculated as described in paragraph 3. Values are calculated as medians based upon the grid of assessment models as agreed by the WCPFC Scientific Committee.
The target reference point is the average of these two values (weighting of 50/50). This was estimated from the 2022 WCPO skipjack tuna stock assessment at 50 per cent of SBF=0*.
b) Limit reference point: 20 percent of the estimated recent average spawning potential in the absence of fishing, calculated as described in paragraph 3.
*SBF=0 = spawning stock size that would exist in the absence of fishing
While the harvest strategy was officially adopted in December 2022, it is not yet legally binding. The harvest strategy will guide rather than direct fishing activity for WCPO skipjack tuna during an unspecified trial period.
Specifications:
Adopted in 2022, the performance of the harvest strategy will be reviewed in year 2025.
19Harvest Strategy in development
Western and Central Pacific Fisheries Commission
2025
The objective of the interim Management Procedure for South Pacific albacore is to ensure that:
MSE was used to evaluate several harvest strategies. The South Pacific Group of members and Australia proposed a full harvest strategy in 2024, but it was not adopted. More discussion will occur in 2025.
20Harvest Strategy in development
Inter-American Tropical Tuna Commission
2024
In development and not officially adopted, but often assumed to be BMSY based on Article VII(1)c of the Antigua Convention.
Reference points being developed as part of current MSE process.
*SSB0 = spawning stock size that would exist in the absence of fishing
*R0 = recruitment (i.e., number of young fish) that would exist in the absence of fishing
*steepness – the fraction of virgin recruitment obtained when a stock is at 20% of its unfished size. A steepness of 0.75 indicates that a stock is productive enough to still produce 75% of its maximum reproductive output, even when it is depleted to just 20% of its initial population size.
Candidate model-based harvest strategies are being developed as part of current MSE process.
Current interim HCR developed without MSE testing:
21Active Harvest Strategy

International Pacific Halibut Commission
2020
*SSB0 = spawning stock size that would exist in the absence of fishing
Using MSE to evaluate several model-based harvest strategies; HS must have ≥ 50% chance of achieving the target and ≤10% chance of breaching the limit
Interim harvest control rule:
*SPR = Spawning Potential Ratio, or the lifetime spawning output that a young fish is expected to produce under current fishing mortality compared to what it would produce in the absence of fishing.
Interim harvest strategy in place since 2020 to set the allowable coastwide catch, but adoption of a final, formal harvest strategy has yet to occur, in part due to ongoing negotiations about how to allocate the catch among Alaska, Canada, and the U.S. West Coast. Final mortality limits are determined based on the previous year’s limits, the interim harvest strategy, and social and economic considerations. MSE development continues and is exploring size limits and stock assessment frequency as part of the harvest strategy.
22Harvest Strategy in development
North East Atlantic Fisheries Commission/ North-East Atlantic Coastal States
2026
Aiming at ensuring harvest rates within safe biological limits, and consistent with the precautionary approach* and the maximum sustainable yield (MSY) approach.
*ensure with a high probability (95%) that the size of the stock is maintained above Blim
*Bpa = A stock size above which the stock is considered to have full reproductive capacity. Pa stands for precautionary approach.
A few harvest control rule (HCR) options were explored by ICES (2018). A HCR and Reference Points were adopted that set a total allowable catch (TAC) when biomass is above/below biological reference points (Bpa, Blim, etc.)
Noted Constraints:
23Harvest Strategy in development
North-East Atlantic Fisheries Commission/ North-East Atlantic Coastal States
2027
Aiming at ensuring harvest rates within safe biological limits, and consistent with the precautionary approach* and the maximum sustainable yield (MSY) approach.
*ensure with a high probability (95%) that the size of the stock is maintained above Blim
*Bpa = A stock size above which the stock is considered to have full reproductive capacity. Pa stands for precautionary approach.
An interim harvest control rule (HCR) has previously been explored by ICES that sets a total allowable catch (TAC) when biomass is above/below biological reference points (Bpa,Blim, etc.)
Noted Constraints:
24Active Harvest Strategy
International Commission for the Conservation of Atlantic Tunas
2025
Limit Reference Points: SSB<0.4*SSBMSY
To be retuned to 60% PGK in 2025.
In addition to the retuning, the candidate management procedures will also undergo climate robustness tests.
Management procedure for Western Atlantic skipjack tuna – Recommendation 25-02.
25Harvest Strategy in development
Western and Central Pacific Fisheries Commission
2026
Initial proposals for the Southern longline, tropical longline, and tropical purse seine fishery include biological, economic, social, and ecosystem objectives.
Evaluating a harvest control rule and harvest strategy through a mixed fishey modelling framework that develops model-based harvest strategies for bigeye, but is set up to achieve objectives across multiple species, including yellowfin, skipjack, and South Pacific albacore.
Initial mixed fishery framework explored via MSE; Next steps include operating model conditioning, the development of candidate management procedures for bigeye for the tropical longline fishery, and the development of mixed fishery, multi-species performance indicators. Input needed from managers on management objectives and target reference points.
26Harvest Strategy in development
Western and Central Pacific Fisheries Commission
2026
Initial proposals for the Southern longline, tropical longline, and tropical purse-seine fishery include biological, economic, social, and ecosystem objectives.
Evaluating a harvest control rule and harvest strategy through a mixed fishery modelling framework. Under this framework, fisheries are managed through single stock management procedures for skipjack, South Pacific albacore and bigeye. Under this approach, there is no single stock management procedure for yellowfin. The impact of the skipjack, South Pacific albacore, and bigeye management procedures on yellowfin would then be evaluated using a combined evaluation framework to identify whether the mixed fishery framework can simultaneously achieve management objectives for the stocks.
Initial mixed fishery framework explored via MSE; The next steps include operating model conditioning, the candidate management procedures for the tropical longline fishery, and the development of multi-species performance indicators. Input is needed from managers on management objectives and target reference points.
27Active Harvest Strategy
North Pacific Fisheries Commission
2024
Interim Management Objectives:
1). Recovery of the stock (prioritized objective):
2). Avoiding the unsustainable state of the stock (secondary objective):
3). Achieving high and stable catch (tertiary objective):
Interim Biological Reference Points:
A “hockey stick” harvest control rule reduces fishing intensity as the stock declines below the target reference point at BMSY. Maximum allowable change of the annual catch level in the entire area is restricted to 10%.
Objectives and components of an MSE-tested Management Procedure are to be developed. CMM 2024-08 states: “The SWG MSE PS shall endeavor to consider the establishment of a management procedure to be formulated through an MSE process by the 11th Commission Meeting in 2027.”
Conservation and Management Measure (2024-08) For Pacific Saury: CMM 2024-08 For Pacific Saury (Effective date: 15 May 2024) | NPFC
28Harvest Strategy in development
North East Atlantic Fisheries Commission / North-East Atlantic Coastal States
2026
*Bpa: biomass below which action should be taken, (pa= precautionary approach)
Explored 5 harvest control rules that derive a target fishing mortality based on spawning stock biomass, including combinations of limitations on interannual variability in total allowable catch (aka stability), and various catch banking and borrowing schemes (e.g 10% banking of total allowable catch and 10% borrowing applied in alternate years, suspended when SSB is below the biomass trigger value)
Full MSE completed by ICES in 2020, but no decision taken by the Coastal States of NEAFC on a final management strategy. The Coastal States of NEAFC are considering an update to the MSE in 2025.
29Harvest Strategy in development
International Commission for the Conservation of Atlantic Tunas
2027
TBD
TBD
TBD
2025: SCRS to determine feasibility and costs of an MSE framework. The Commission to discuss operational management objectives and performance indicators.
2026: Test candidate management procedures (CMPs) in consultation with SCRS and the Commission
2027: Adopt MP
2028: Exceptional Circumstances Protocol
Proposed Roadmap for the ICCAT Management Strategy Evaluation (MSE) for Blue Shark
30Harvest Strategy in development
International Commission for the Conservation of Atlantic Tunas
2027
TBD
TBD
TBD
2025: SCRS to determine feasibility and costs of an MSE framework. The Commission to discuss operational management objectives and performance indicators.
2026: Test candidate management procedures (CMPs) in consultation with SCRS and the Commission
2027: Adopt MP
2028: Exceptional Circumstances Protocol
Proposed Roadmap for the ICCAT Management Strategy Evaluation (MSE) for Blue Shark
31Harvest Strategy in development
International Commission for the Conservation of Atlantic Tunas
2026
Limit Reference Points: 0.4*BMSY
TBD
2025- Stock assessment for BET and further develop MSE
2026 – Test candidate management procedures and adopt an MP
32Harvest Strategy in development
International Commission for the Conservation of Atlantic Tunas
2027
Limit Reference Points: The SCRS should use 40% of the spawning stock biomass at Maximum Sustainable Yield as the interim BLIM for southern Atlantic albacore tuna, or advise on a different value, if appropriate.
Six candidate harvest strategies have been tested in 2025, but further rules will be developed and evaluated.
2025 – 2026: Stock assessment and MSE framework development.
2027: Test and finalize candidate management procedures (CMPs). Adopt MP.
2028: Adopt an exceptional circumstances protocol.
33Active Harvest Strategy
General Fisheries Commission for the Mediterranean
2025
Conceptual Management Objectives:
Candidate Management Performance Metrics:
Candidate Harvest Strategies: TBD
The first session of the Working Group on Management Strategy Evaluation (WGMSE) for blackspot seabream was held in 2024, during which key uncertainties, management objectives, and potential methodologies were discussed. The WGMSE intends to adopt an MSE for blackspot seabream in 2025 that will begin managing the stock in 2026. Multiple meetings of the WGMSE on blackspot seabream are scheduled for 2025. Blackspot seabream continues to have a critically depleted stock status.
34Active Harvest Strategy
General Fisheries Commission for the Mediterranean
2024
Other conceptual management objectives:
Catch levels are set annually based on a harvest control rule (HCR) that manages the fisheries targeting both Adriatic Sea sardine (Sardina pilchardus) and European anchovy (Engraulis encrasicolus).
The catch limits for small pelagic fisheries in the Adriatic Sea were set using the MSE-tested MP for the first time in 2025. Catch limits will continue to be updated annually using the HCR, per the MP specifications.
35Active Harvest Strategy

General Fisheries Commission for the Mediterranean
2024
Other conceptual management objectives:
Catch levels are set annually based on a harvest control rule (HCR) that manages the fisheries targeting both Adriatic Sea sardine (Sardina pilchardus) and European anchovy (Engraulis encrasicolus).
The catch limits for small pelagic fisheries in the Adriatic Sea were set using the MSE-tested MP for the first time in 2025. Catch limits will continue to be updated annually using the HCR, per the MP specifications.
36Harvest Strategy in development
Indian Ocean Tuna Commission
TBD
TBD
TBD
TBD
As of the 29th annual meeting of the IOTC Commission in 2025, funding has been allocated to begin progress on developing an MSE for blue sharks. A blue shark stock assessment is scheduled for 2025, which will help inform the development of operating models (OMs) for the MSE.